PROJECTED DAM PERFORMANCE
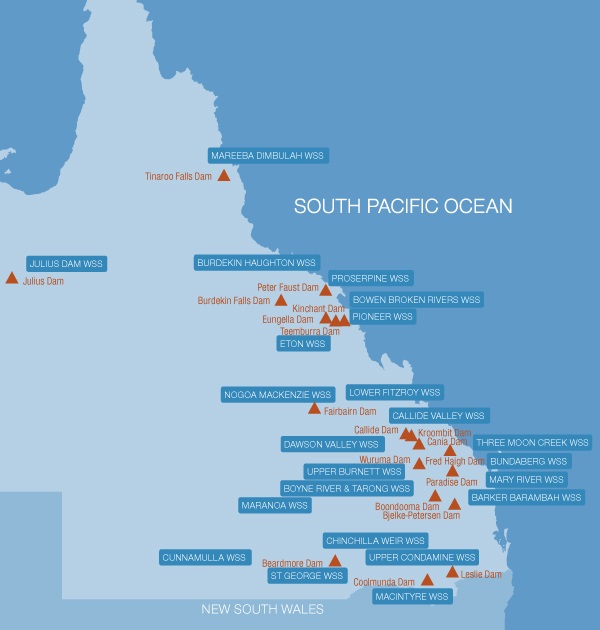
Click on the Storage links (on the map or list) to view the storage level information for that particular dam.

Disclaimer, Assumptions and Limitations
- While every care has been taken in preparing this publication, Sunwater accepts no responsibility for decisions or actions taken as a result of any data, information, statement or advice, expressed or implied, contained within.
- Near real-time data is presented, based on automated data feeds which has not been verified and is subject to change.
- Projections presented is only an indicator of some possible outcomes based on historical observations. Projections presented are by no means an assured outcome and are not an exhaustive indication of all possible outcomes.
- Projections presented does not utilise forecasting methods, and therefore does not consider climate change or assess confidence bounds.
- NOTE: Callide Dam FSL was temporarily dropped between 2021-2022 which impacts on the displayed % Capacity for those years.
- NOTE: Paradise Dam FSL was reduced in 2020 & 2021 which impacts on the displayed % Capacity and Baseline projection in those years.
Historical Dam Levels:
- These levels are each of the previous 10 years daily water level readings, overlayed to show year-on-year performance.
- Capacity curves are a percentage of the full supply volume (ie. 100% capacity = full supply volume).
- Full supply volumes are subject to change and are, to the best of our knowledge, current at the time of publishing.
Baseline Projection:
- The history-based projection applies the daily change in dam volume observed in previous years from today onwards.
- Minimum and median trends are based on the change in volume from today to the end of the 6 month period using up to 30 years of historical record.
- When spills occurred in the historical data record, the calculated volume lost to spill has been returned to the water balance on that day as an inflow.
- No consideration to other factors that influence dam volumes over time has been given to the data presented. This includes observed weather patterns and the changing climate.
- No consideration to the dam starting volume in historic years in comparison to today's volume has been given.
- No consideration to the changing utilisation rates (announced allocations) which are dependent on the dam volume and various other factors has been given for any of the trend lines.
